The Demise of the NASDAQ
For almost an entire year, the NASDAQ has been on a downward descent, contracting by a total of 35% (so far). As consumer sentiment shifted; citing overbearing inflation concerns, the broader market transitioned from a bullish to a bearish narrative. Apple is by far the greatest component of the index composing 13.7% followed by Microsoft (10.5%), Amazon (6.7%), and Tesla (3.9%). Although not directly under Tesla, Meta (2.6%) is still worth a mention for their horrific share price activity of late. As can be seen in Figure 1, the NASDAQ is currently poised in a critical area due to strong support around the $11,000 mark. This has been confirmed by being retested on four occasions. All eyes are focused on the November 14th CPI report as another beat will most likely result in further pressure to the downside. Although the focus of this report remains on the NASDAQ, a breakdown of a few previously mentioned companies will be analysed and critiqued to derive the most probable outlook for future price action movements.
NASDAQ Price Action: 2015 – 2023
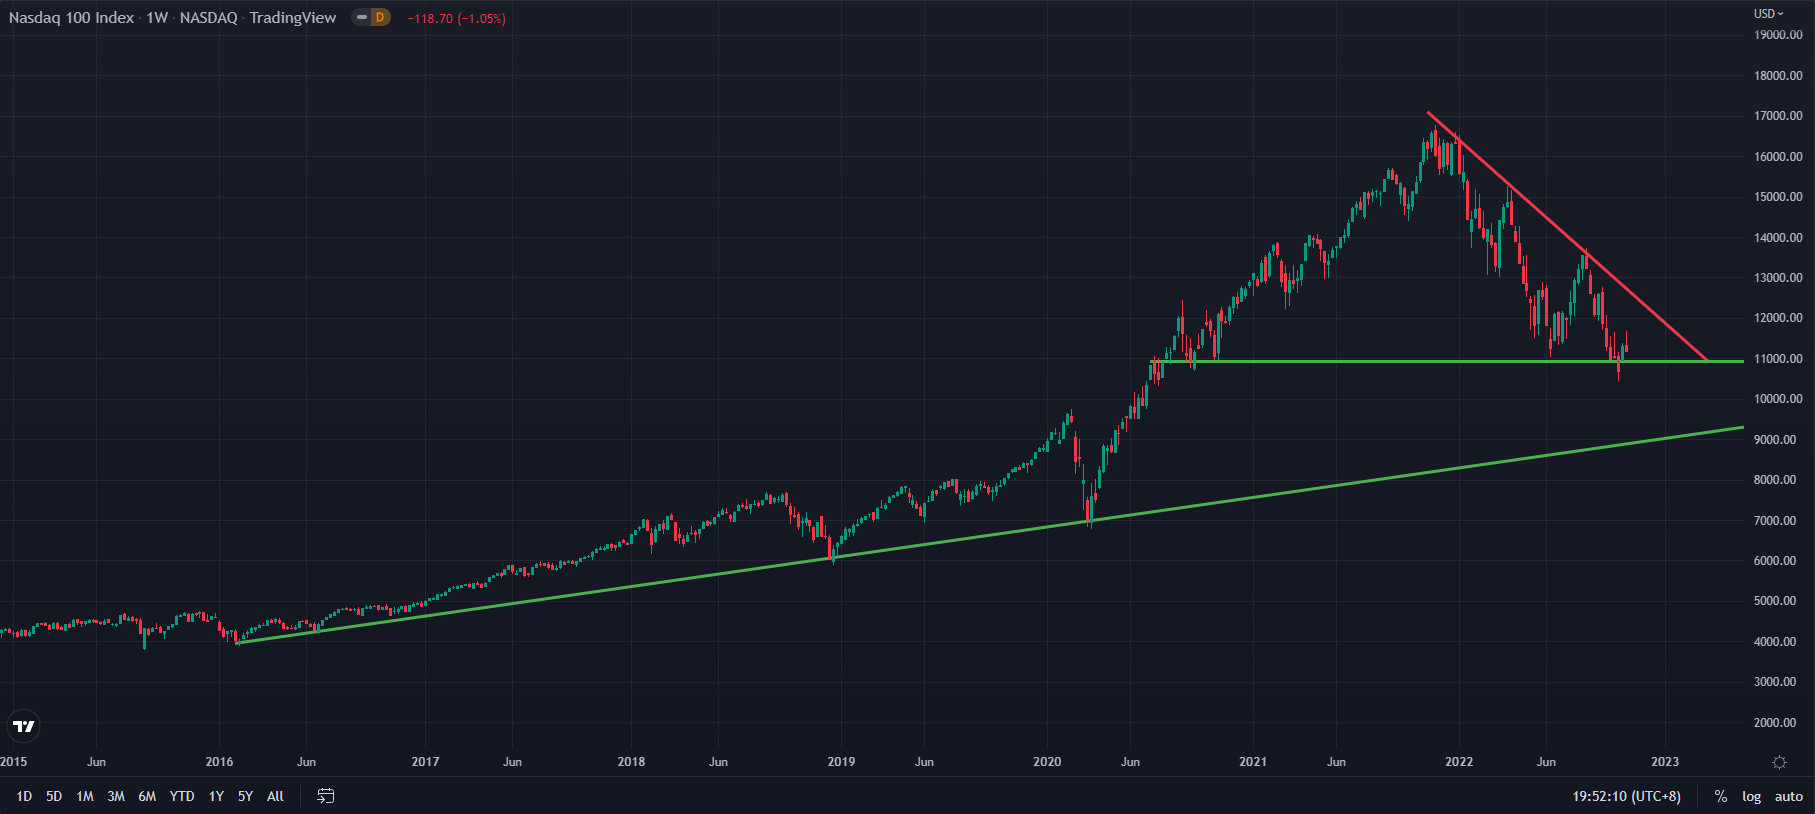
Figure 1: Derived from TradingView for the purple of this report.
Amazon Price Action: 2013 - 2023
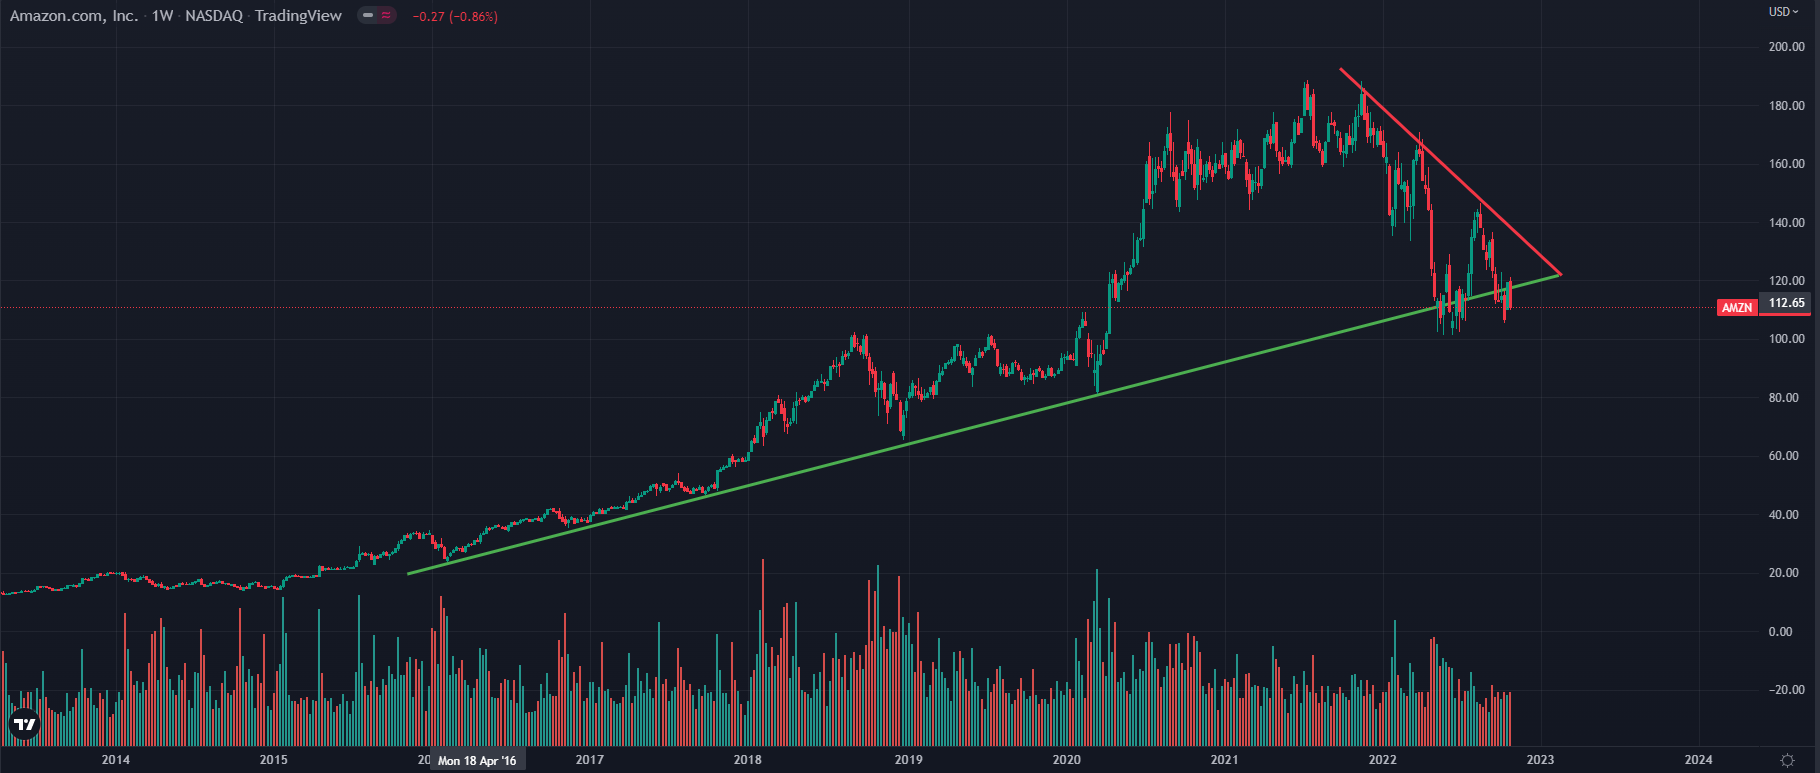
Figure 2: Derived from TradingView for the purple of this report
If you were to buy just $10,000 worth of Amazon stock at the start of 2016 and miraculously time the sell at the peak of around $188 post-split, you would be up a whopping 730% bringing you’re initial $10,000 investment to a cool $73,000 in just 6 years. Since peaking at just over $188, the incredible decade-long bull run has finally started to blow off some steam. The green line observed in figure two illustrated the long-term support level that the Amazon price action has adhered to for the past 6 years bouncing off the support for a cumulative total of six times before finally being temporarily breached in May 2022 where a short consolidation occurred before rallying to the red descending resistance line. The fuel which fired Amazon’s rally on the 29th of July came in the form of a positively perceived second-quarter financial report that noted a $2.04 billion revenue beat totaling $121 billion for the quarter as well as their AWS cloud computing business which jumped 33%. All eyes will be on Amazon’s fourth-quarter results as anything perceived as negative will result in a failed back test of current support and most likely cause the share price to plunge where there is next to no support.
Microsoft Price Action: 2015 - 2023
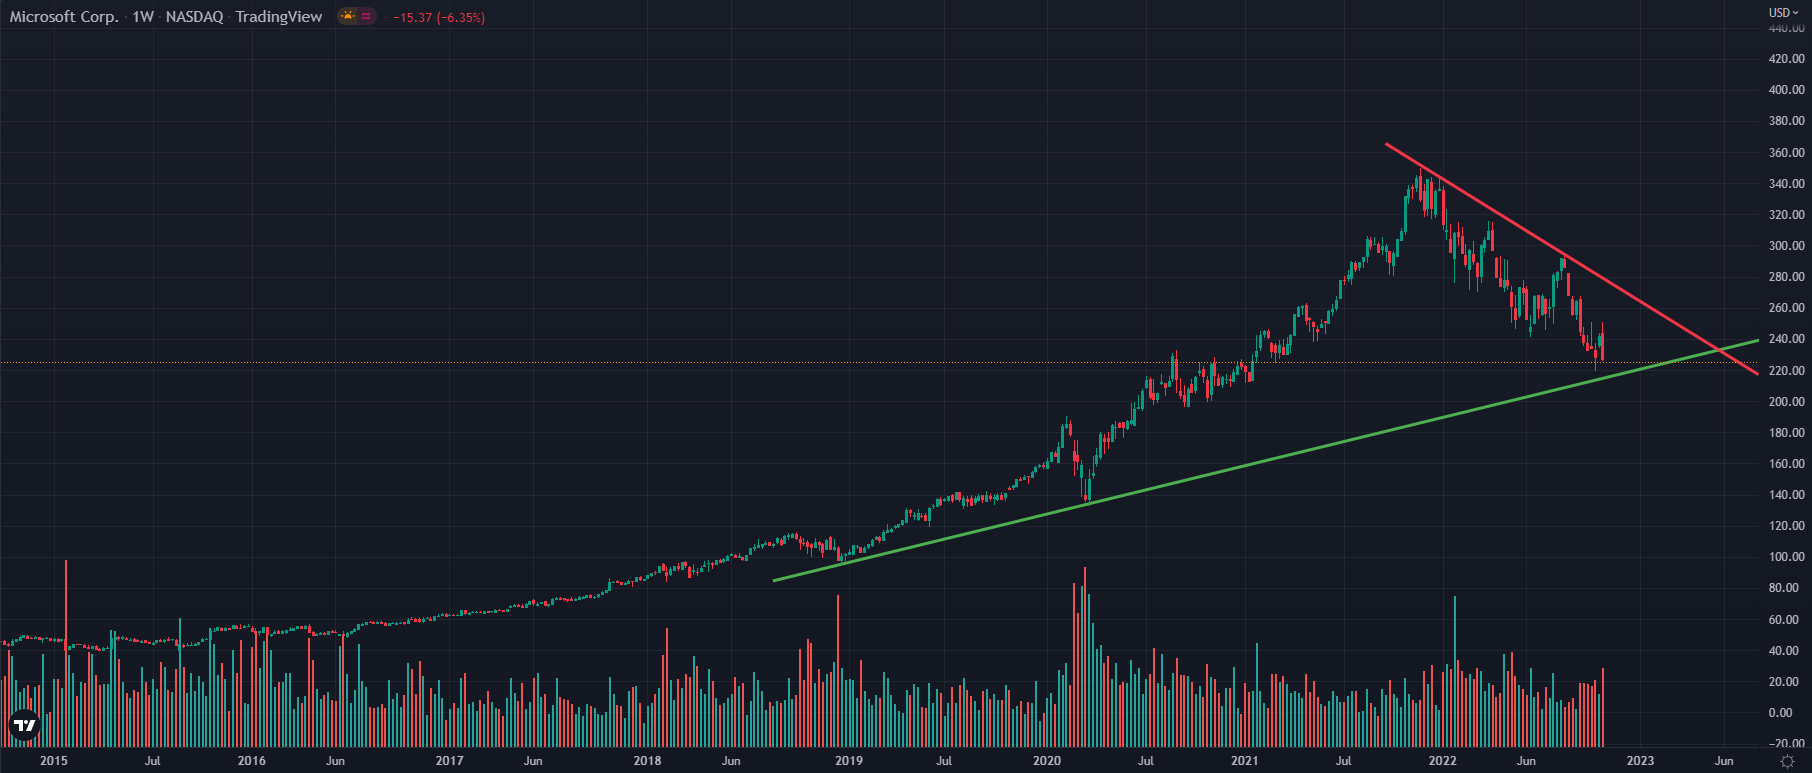
Figure 3: Derived from TradingView for the purple of this report
Since the start of 2022, Microsoft shares have tumbled 38%. The tech giant has a whopping 10.5% weighting in the NASDAQ which doesn’t come as a surprise considering how closely the price actions between the two are aligned as can be seen in Figure 3 vs Figure 4. Microsoft’s growth over the last three months grew 11% to just over $50 billion regardless of lower pc demand seen recently. In the third quarter of 2022, PC shipments fell almost 20%. Although Microsoft shares have fallen 38% in such a small period of time, the pain is being felt throughout the whole sector as many of Microsoft’s competitors such as AMD, have fallen a lot more. The CEO of Microsoft, Satya Nadella mentioned the significance of Microsoft teams and how it has somewhat become the de facto standard for collaboration along with 55% of the enterprise users also paying for add-ons which have greatly helped Microsoft’s results. Technically speaking, Microsoft is currently in a critical area. Price action has been gradually declining, to a point where the four-year support and resistance are crossing. It can be seen in figure 3 that volume has begun to pick up following recent declines in the stock signaling further downside to come. If volume continued to flow, based on current market sentiment and inflation concerns, it doesn’t matter how well Microsoft performs from a financial view, price action will most likely continue to tread lower.
Meta Price Action: 2017 - 2023
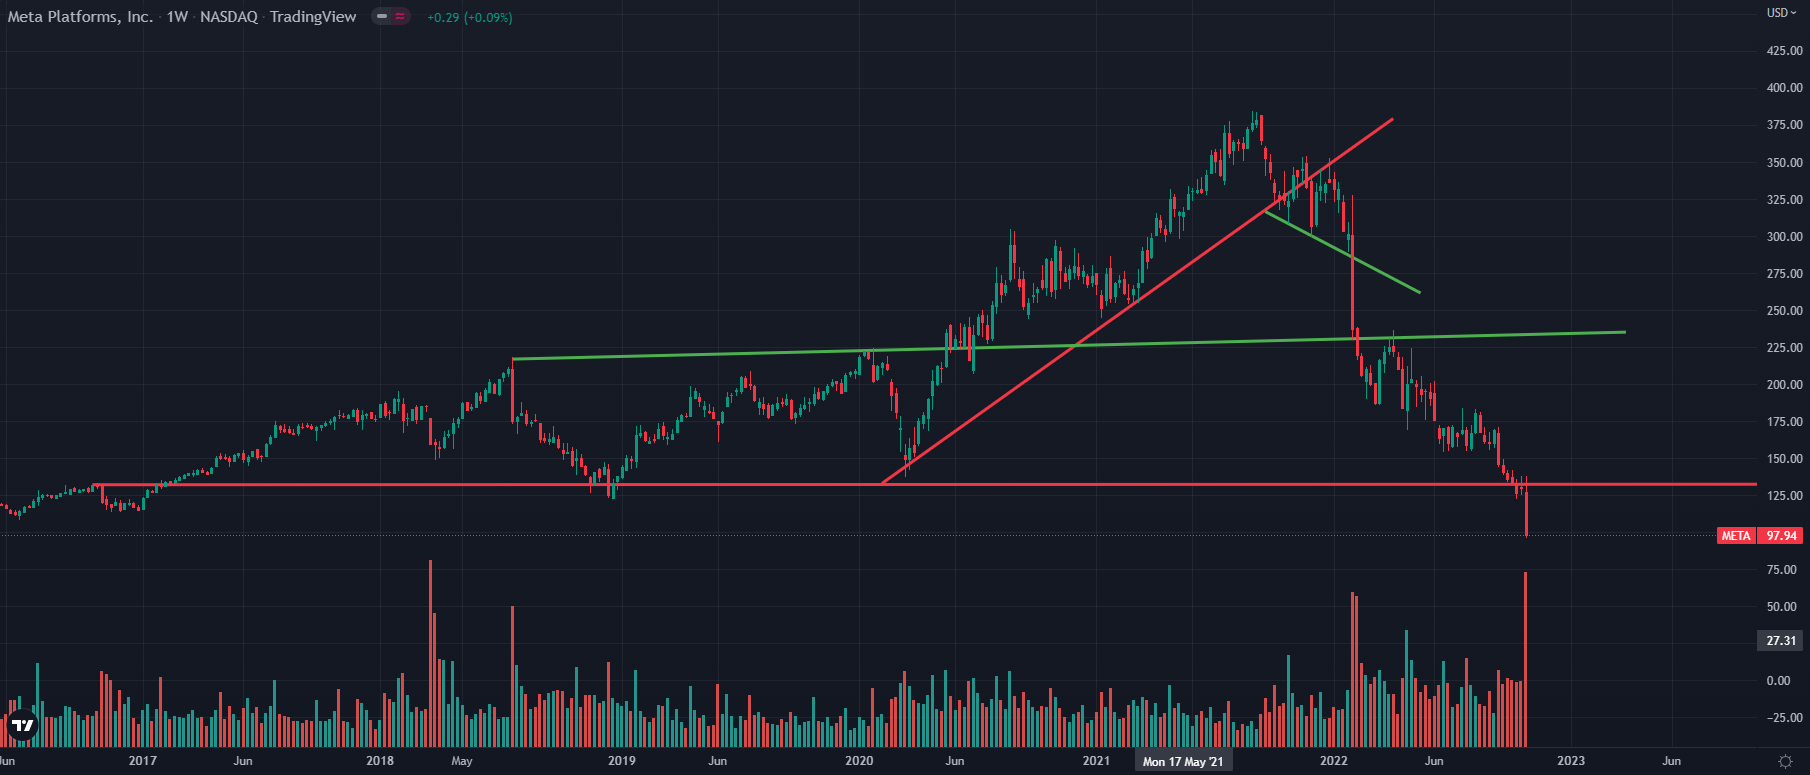
Figure 4: Derived from TradingView for the purple of this report
Meta has been a crowd favorite and it seems to just not be able to catch a break. During the first week of February this year was when the Meta caught our eye, finishing up the week down 22% and breaking through the 120-day descending support. The sharp fall came after the tech conglomerate announced their fourth-quarter results and well… there wasn’t much to like. Revenue diminished by 20%, net income shrunk by 8% and if that wasn’t enough insult to injury, Mr Wehner (CFO) came out and forecasted a growth to the business top line of only 3-11%. Aside from all this, it was unveiled that the Facebook platform had its first-ever decline in daily average users poising the question of its longevity. Investors had become so accustomed to continued growth and that although small, the decline in users sent the share price tumbling out of control. Since the 3rd of February this year, Meta has continued to spiral down where many believed was a support zone around $132 that would be incredibly hard to break though and can be seen in Figure 4. However, on October 27th Metas share price demise went from bad to worse posting one of its biggest single day losses of -24% on the back of the company’s third-quarter results and fourth-quarter outlook.
Disclaimer
Advice in the Material is provided for the general information of readers and viewers (collectively referred to as "Readers") and does not have regard to any particular person's investment objectives, financial situation, or needs. Accordingly, no Reader should act on the basis of any information in the Material without properly considering its applicability to their financial circumstances. If not properly qualified to do this for themselves, Readers should seek professional advice.
Investing and trading involves the risk of loss. Past results are not necessarily indicative of future results.
The decision to invest or trade is for the Reader alone. We expressly disclaim all and any liability to any person, with respect of anything, and of the consequences of anything, done or omitted to be done by any such person in reliance upon the whole or any part of the Material.